1.Market Cap above 10B
2.PE <25
3.ROE>10%
雖說是隨機取樣, 但畢竟是真投資,我還是要設定一些條件,也不是太嚴格,所以非常好找.
http://finviz.com/map.ashx?t=sec 利用這個MAP來選股,然後在每一個月初我會做RE-BALANCING,也就是做出比例上的調整,除此之外我是不會動的.
總實驗起始資金:50000 US DOLLARS, 90% in stocks
期望報酬: 打敗大盤, 統計數據說只有15%的基金經理人打敗大盤
72 divided by the % rate of return = number of years required to double your original investment
理論說72/投資報酬率=你可以BOUBLE本金的時間, 所以如果你只能賺10%一年, 其實你也只需要7.2年就可以賺100%
2/28/2010
2/27/2010
0227-Long-term investment strategy experiment
這個實驗的目的很簡單,分析長期投資策略的有效性
簡單的步驟如下:
1.採用隨機取樣S&P 500股票5檔,做長期性持有投資,無論漲跌只有加碼.
2.每周追蹤投資報酬率,並與SPY報酬率比較看看是否打敗大盤.
去年做了技術分析投資了一年,今年3月起我將以這樣的方式投資,不用花太多時間,選股我為了證明是隨機我會用飛鏢決定, 射中哪五檔就用哪五檔, 有人說股票永遠往上漲,那我們就來實驗看看吧.
明後日我將把我射飛鏢的照片PO上來,周一開始投資,並將持股部位公佈出來,每周我們再來檢視有什麼奇蹟出現吧!?
簡單的步驟如下:
1.採用隨機取樣S&P 500股票5檔,做長期性持有投資,無論漲跌只有加碼.
2.每周追蹤投資報酬率,並與SPY報酬率比較看看是否打敗大盤.
去年做了技術分析投資了一年,今年3月起我將以這樣的方式投資,不用花太多時間,選股我為了證明是隨機我會用飛鏢決定, 射中哪五檔就用哪五檔, 有人說股票永遠往上漲,那我們就來實驗看看吧.
明後日我將把我射飛鏢的照片PO上來,周一開始投資,並將持股部位公佈出來,每周我們再來檢視有什麼奇蹟出現吧!?
2/25/2010
0225-果然遇上詐財集團
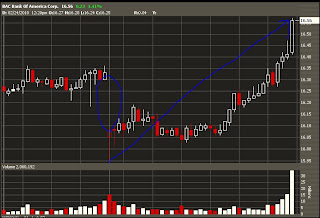
代價就是在BAC賠掉1.7%, 看來原計畫還是比較簡單實在,多想是無意義的! 停損再布局囉!
就這點而言實在很佩服WARREN BUFFET,每天幾十億美金上下卻能不動如山, KO開盤就跌掉3%,我想他應該也不知道幾億美金消失了,但當你有機會RISK other people's money時, 這也不是很難的事情, 波克夏賺還賠,這老先生還是會收管理費的,也會收prefered stock的利息與股利, 光這一點平常人是學不來的,所以分析再分析還是比較實用的.
就這點而言實在很佩服WARREN BUFFET,每天幾十億美金上下卻能不動如山, KO開盤就跌掉3%,我想他應該也不知道幾億美金消失了,但當你有機會RISK other people's money時, 這也不是很難的事情, 波克夏賺還賠,這老先生還是會收管理費的,也會收prefered stock的利息與股利, 光這一點平常人是學不來的,所以分析再分析還是比較實用的.
2/24/2010
0224-Bernanke: Low Rates Needed
The Fed chairman told lawmakers that the U.S. economy needs record-low interest rates for several months at least because the recovery is expected to be slow.
換句話說free money政策繼續,市場上的熱錢繼續流竄, 已投資的資金也不急著撤出,換句話說這個修正恐怕又是個買點了. 個人首選BAC, 待突破16.4後攻勢再起, UCO: 石油有機會突破80
就技術分析而言KD高檔不墜形成背離嘎空, 如今日收盤高點過昨日高點,嘎空段有機會展開.
換句話說free money政策繼續,市場上的熱錢繼續流竄, 已投資的資金也不急著撤出,換句話說這個修正恐怕又是個買點了. 個人首選BAC, 待突破16.4後攻勢再起, UCO: 石油有機會突破80
就技術分析而言KD高檔不墜形成背離嘎空, 如今日收盤高點過昨日高點,嘎空段有機會展開.
2/23/2010
2/18/2010
2/17/2010
2/11/2010
2/10/2010
2/09/2010
0209-Dow Jones高達200點的反彈

ok~反彈了, 但我為何說是反彈不是回升呢? 因為5浪還是沒走完, 所以我個人認回這反彈結束後還是會再殺一波完成"破底翻",所以配合"滿月效應", 我建議 二月26前後應可見低點, 因為28是滿月囉,但那天不能交易,所以提前見低也是有機會的.
Euro今日也是強彈,但還不穩定, 別忘了上周3也是強彈到1.40後就崩盤到1.358, 今日雖強彈到1.38但如無法支撐3日以上也可能只是曇花一現.
0209-正背離買點的契機
CCI 指標的正背離出現如可在KD出現轉折的話+配合第四浪反彈, 將有機會止跌, 重點就是上周五低點不可再破, 1040~1050之間築短底反彈機會大, 策略一樣:空單準備獲利了結但伺機而動, 不要預設太多立場.
2/08/2010
0208-so far so good
大盤沒有做出太強勢的反彈抵抗, 因此對空頭部位的我而言是個好消息,策略就是續抱,以不變應萬變, 早盤如預期做出低抗的大盤讓我有驚無險,但還不到中場前就已發現疲乏現象,收盤再度跌破開盤低點,第三浪還在進行中空方暫無須收手.
2/06/2010
0205--一股不可思議的力量
巨量止血?
下半場出現的這股強大買盤是否能夠止血!? 我認為反彈並無必要, 因為技術上而言在第三浪未擴及為最長浪之前見低可能性不高, 但就心理關卡而言, 多方力守道瓊10000點情有可原, 投資人信心不潰散才有持續的新資金湧入, 基金經理人才有手續費可賺, 下周一可要再收陽線即可形成反轉訊號, 且量比價先行, 爆大量容易形成短線反彈, 因此持有空頭部位的投資人應見周一上半場形勢決定是否獲利出場.
下半場出現的這股強大買盤是否能夠止血!? 我認為反彈並無必要, 因為技術上而言在第三浪未擴及為最長浪之前見低可能性不高, 但就心理關卡而言, 多方力守道瓊10000點情有可原, 投資人信心不潰散才有持續的新資金湧入, 基金經理人才有手續費可賺, 下周一可要再收陽線即可形成反轉訊號, 且量比價先行, 爆大量容易形成短線反彈, 因此持有空頭部位的投資人應見周一上半場形勢決定是否獲利出場.
2/04/2010
2/03/2010
2/02/2010
0202-another technical view
熟悉波浪理論的人應該知道 i 代表的意思, 5浪中的第一浪而以.
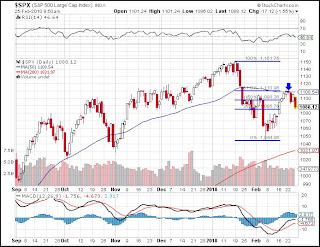
The final subdivisions of the decline that started at the Dow's January 19 top at 10,729.90 are somewhat sloppy. Either Friday's 10,043.80 low marks the bottom of wave i (circle), or it represents wave (b) of ii (circle). Both interpretations mean essentially the same thing: A countertrend push is underway that should carry prices higher before ending. The first potential stopping area is 10,285.10-10,306.00, the bottom of which is wave (iv). The equivalent S&P area is 1101-1104. The next area is 10,386.80-10,389.90, the top of which is a small open gap from the close on January 21. Here, the S&P's equivalent range is 1111-1117. There are other resistance areas, but we'll assess the rise as prices reach the ones just cited to determine if wave ii (circle) up is complete, or if it has higher possibilities.
The final subdivisions of the decline that started at the Dow's January 19 top at 10,729.90 are somewhat sloppy. Either Friday's 10,043.80 low marks the bottom of wave i (circle), or it represents wave (b) of ii (circle). Both interpretations mean essentially the same thing: A countertrend push is underway that should carry prices higher before ending. The first potential stopping area is 10,285.10-10,306.00, the bottom of which is wave (iv). The equivalent S&P area is 1101-1104. The next area is 10,386.80-10,389.90, the top of which is a small open gap from the close on January 21. Here, the S&P's equivalent range is 1111-1117. There are other resistance areas, but we'll assess the rise as prices reach the ones just cited to determine if wave ii (circle) up is complete, or if it has higher possibilities.
0202反彈壓力帶-short hot spot!?
plus: T-theory:
The W Bottom in the volume oscillator is likely to be OK for a bounce, but not a buying opportunity. Note as the S&P is breaking below the black mid-channel bullish market support line, the Arms Ratio for the last 4 days has now been 0.75, 0.85, 0.99, 0.46 all overbought readings that imply the market is not actually getting oversold. The market is entitled to rally, bringing up the Volume oscillator to the neutral area around the zero line, then a new decline is likely that will end in new lows near the green envelope. That oversold condition should produce a new buy for the run up to May.
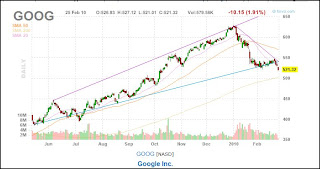
Google 還是沒彈, 領先指標持續破底中...
2/01/2010
訂閱:
意見 (Atom)


